The Estate Tax Bill Most Business Owners Never See Coming
The Estate Tax Bill Most Business Owners Never See Coming is an issue that can significantly impact what is ultimately passed on to heirs.

What actually arrives in the estate from a corporate investment portfolio versus a corporately owned life insurance policy.
Every projection a business owner sees starts with the same seductive number: what the portfolio grows to. That number is almost meaningless. The question that matters for estate planning is a different one entirely: after every layer of corporate tax, refundable tax, passive income grind, and personal dividend tax has taken its cut, what actually arrives in the estate?
This article answers that question for four ways of deploying the same corporate dollars. The answer depends entirely on two accounts most owners have never heard of, the capital dividend account and the refundable dividend tax on hand, and on one penalty most owners learn about only when their accountant delivers the bad news, the passive income grind. And as we will see at the end, the right answer for most clients is not picking one option over the others. It is a blend.
The Setup
The operating company generates $500,000 of annual profit. After the 11% BC small business rate, that leaves $445,000 per year to invest inside the corporate structure. In this analysis, the corporation contributes $445,000 per year for the full 30 years, a total of $13,350,000, and everything is measured at the end of year 30, when the estate event occurs. This assumes the operating company stays active and profitable for the entire period, which also means the passive income grind applies for the entire period.
Option A, the pure capital gains portfolio. All contributions go into individual stocks inside the holding company. Nothing is ever sold, rebalanced, or trimmed for the full 30 years. Every dollar of return is unrealized capital gain until a single liquidation at year 30. Let's be clear: this is seriously unrealistic. Nobody holds a stock portfolio for three decades without a single sale. But it represents the absolute ceiling of tax deferral available to a corporate portfolio, so it is the strongest possible version of the investment alternative, and that is exactly why it is worth modelling.
Option B, the balanced portfolio. The same contributions, the same 7% gross return, but structured the way real portfolios are: 3% of the portfolio value each year arrives as eligible Canadian dividends, 3% arrives as bond interest, and the remaining 1% is capital appreciation. The portfolio is rebalanced annually with a 5% trim that realizes gains. Corporate tax applies every year, RDTOH accumulates, the CDA builds slowly, and the passive income grind eats at the operating company's small business deduction year after year.
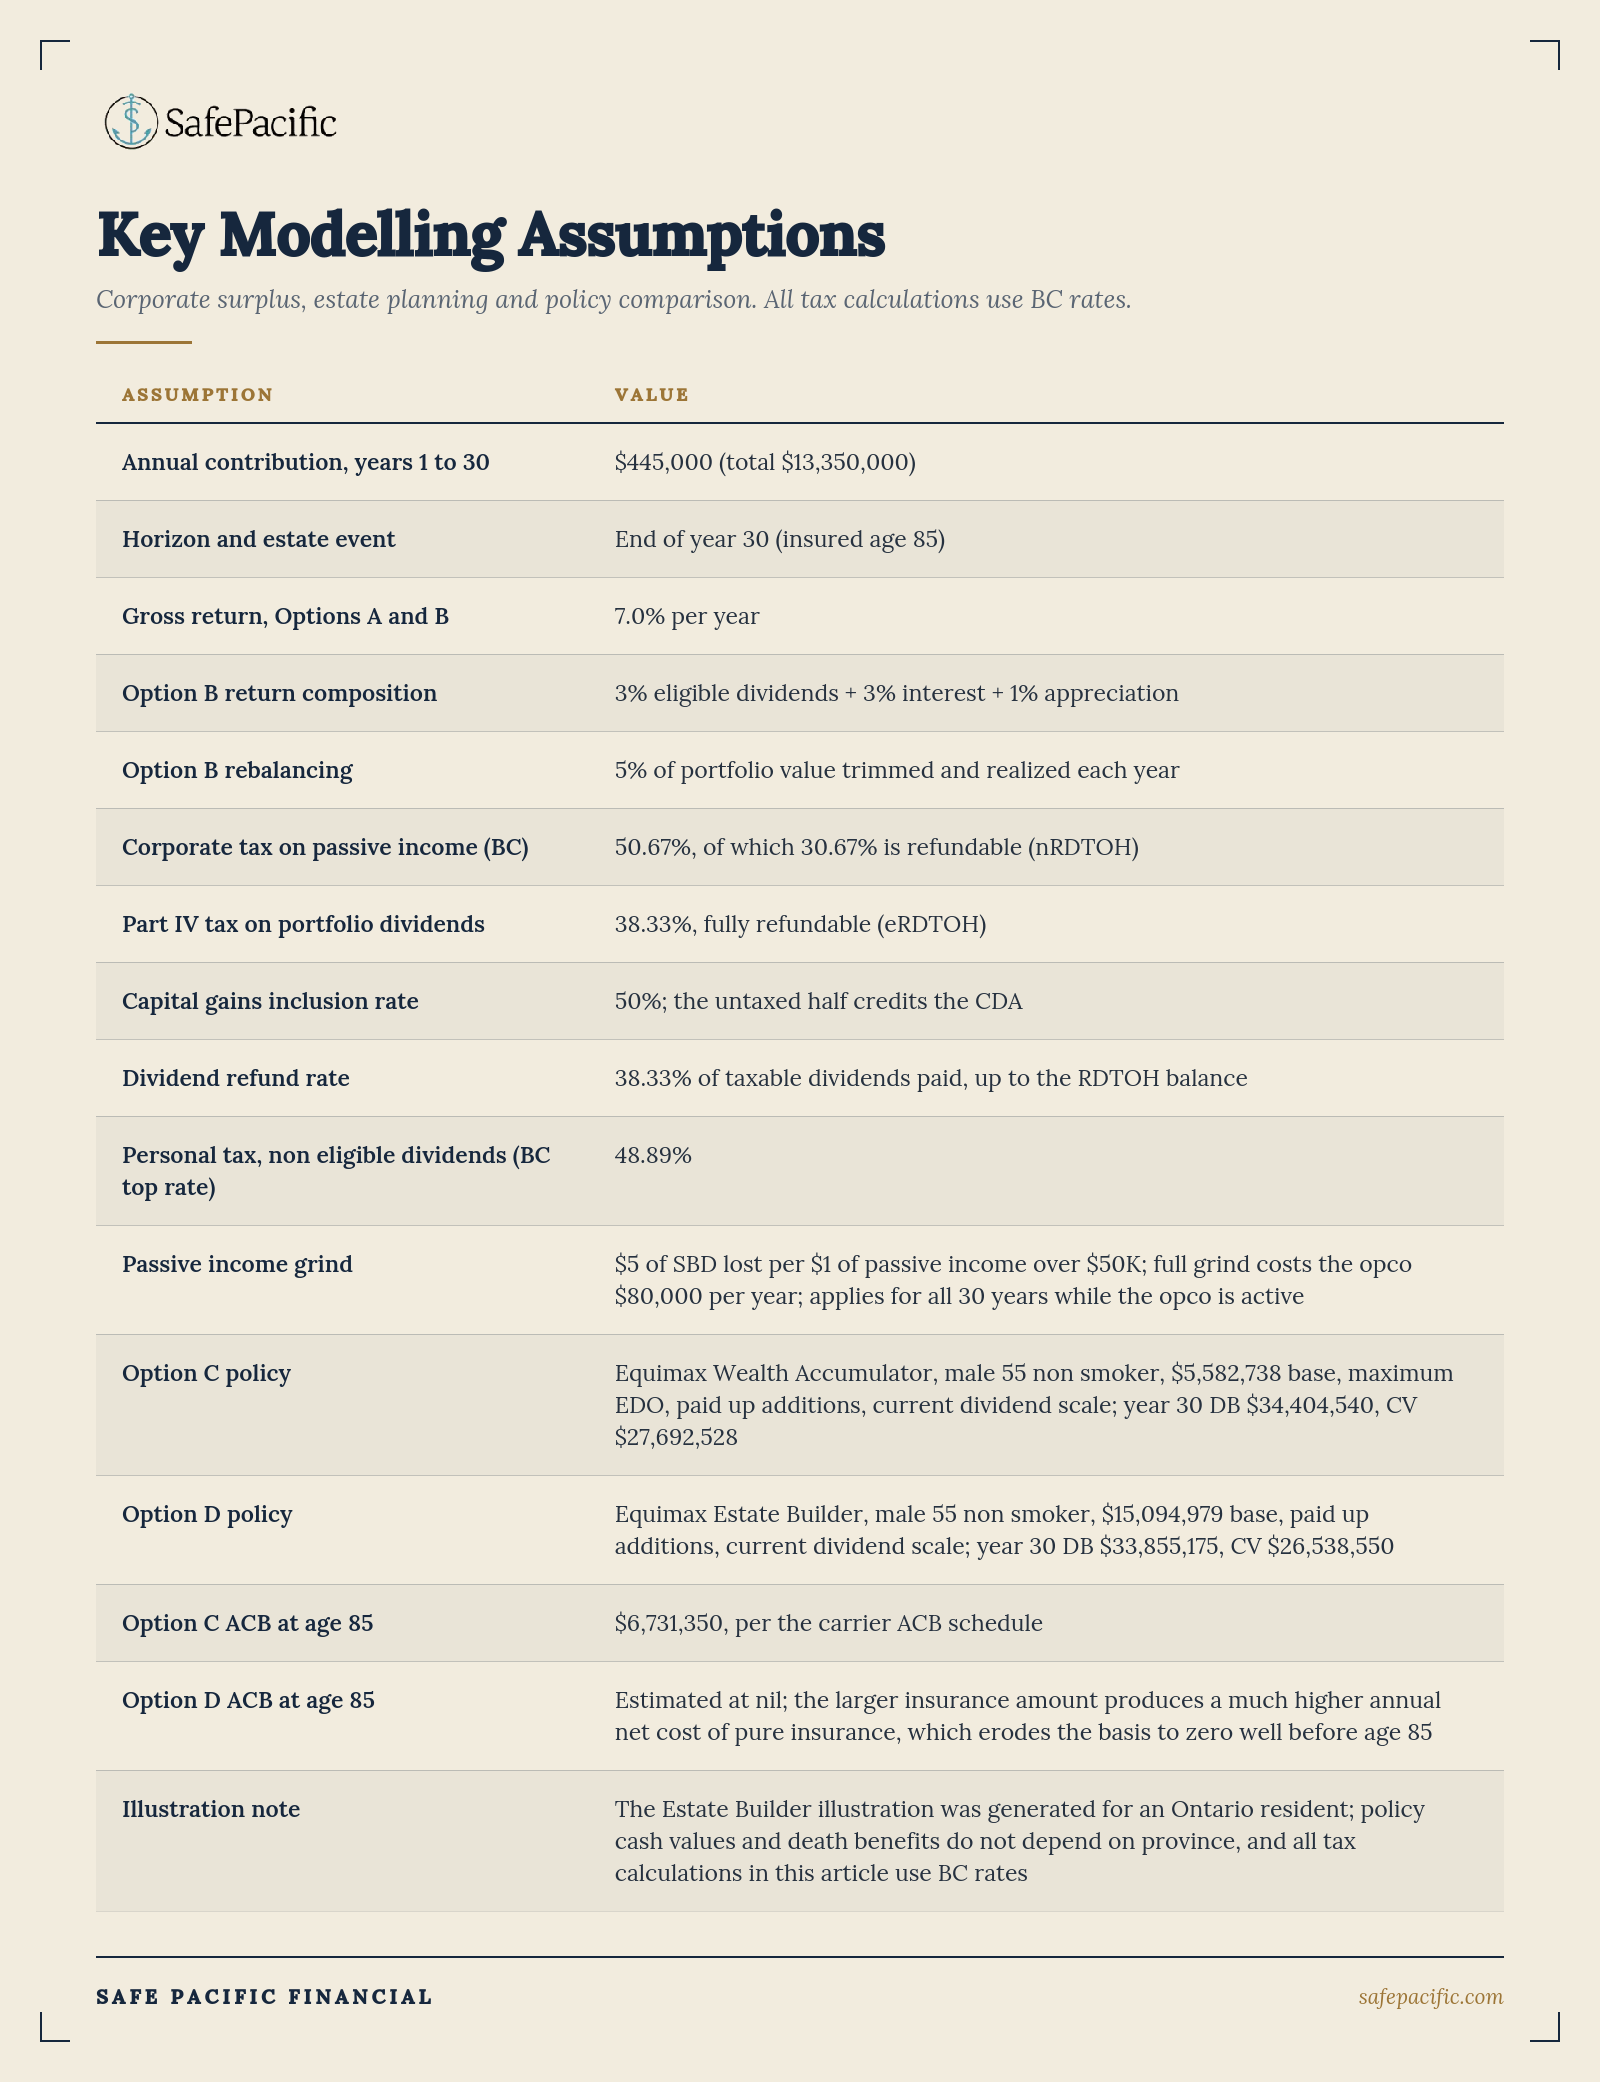
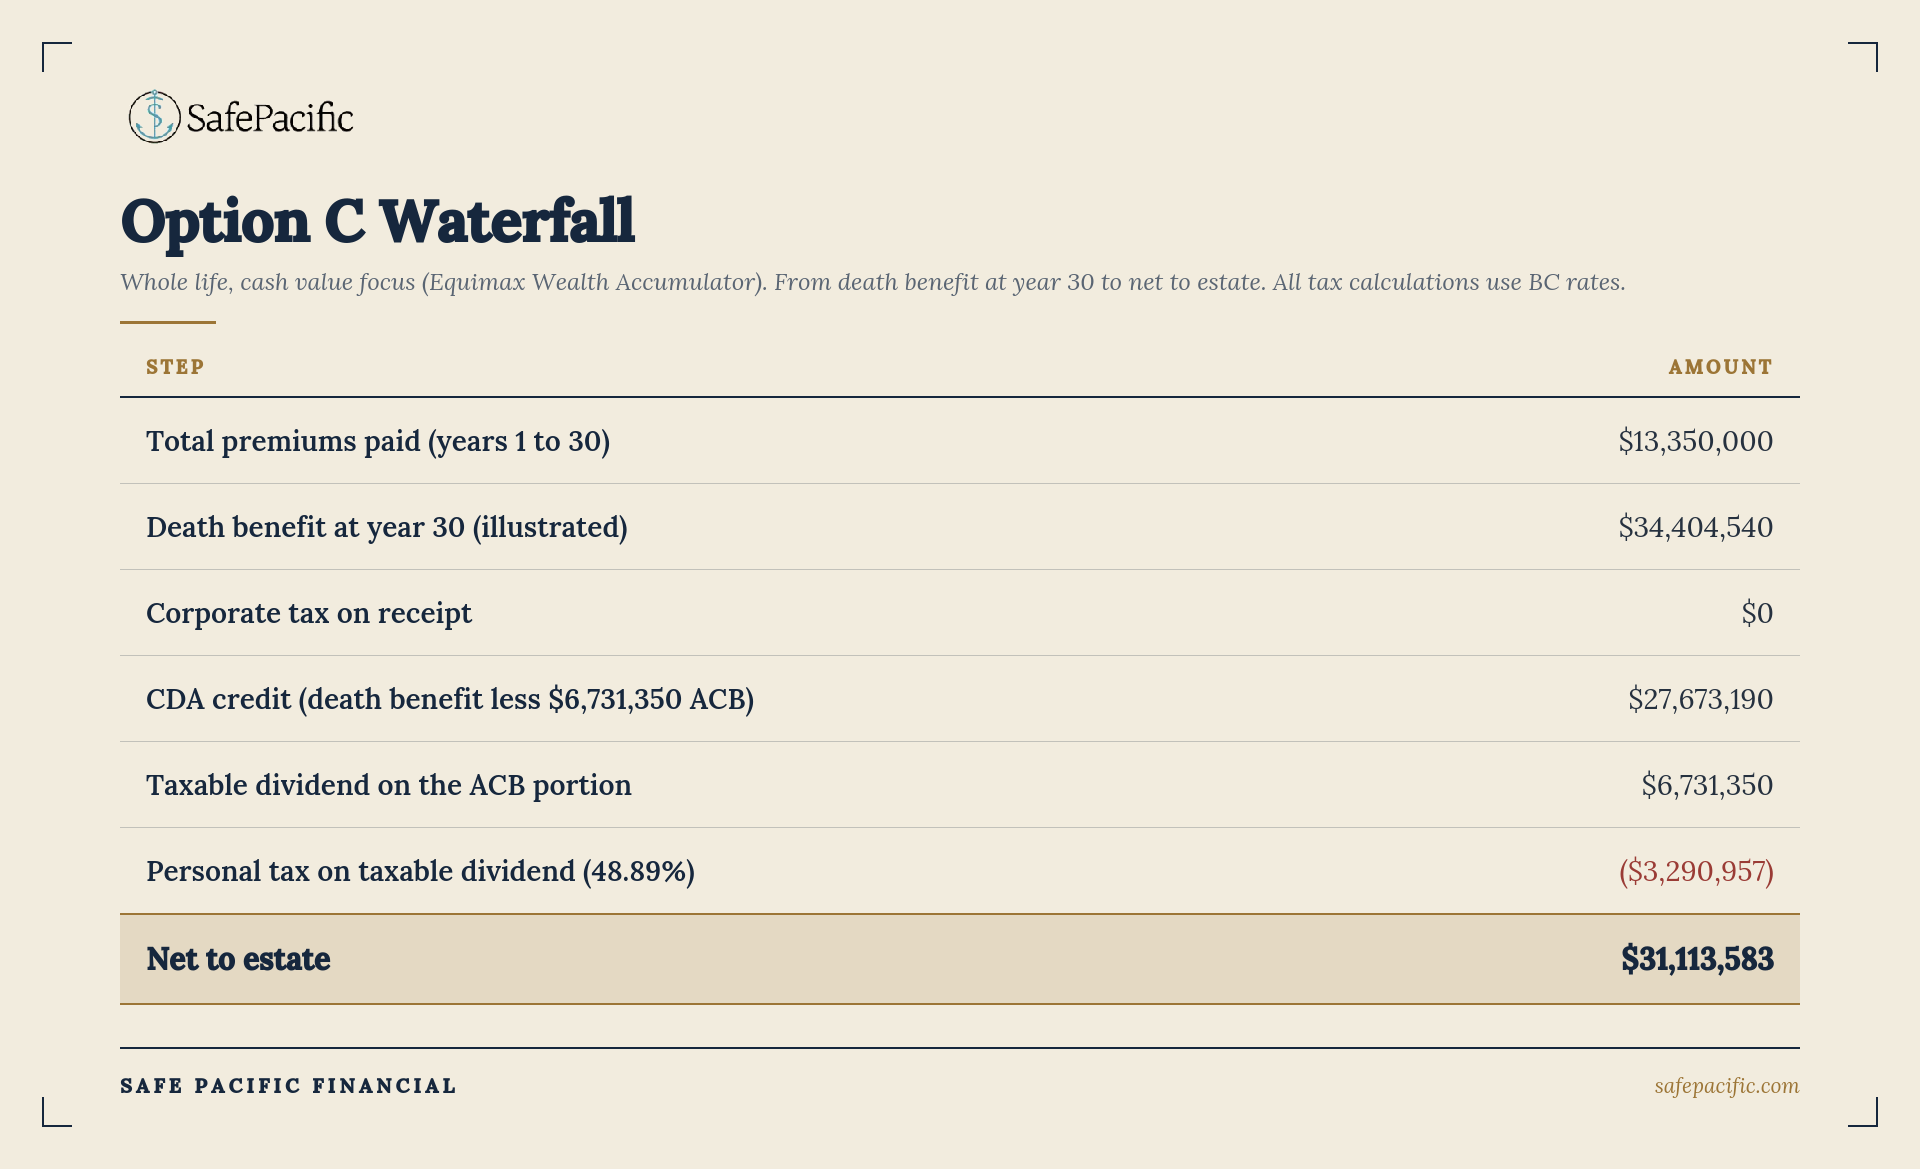
Option C, participating whole life built for cash value. An Equimax Wealth Accumulator policy on a 55 year old male non smoker: $445,000 per year for all 30 years, with the premium structured for maximum early cash value (a smaller base of $5,582,738 plus maximum Excelerator deposits). At year 30 (age 85), the illustrated death benefit is $34,404,540 and the total cash value is $27,692,528.
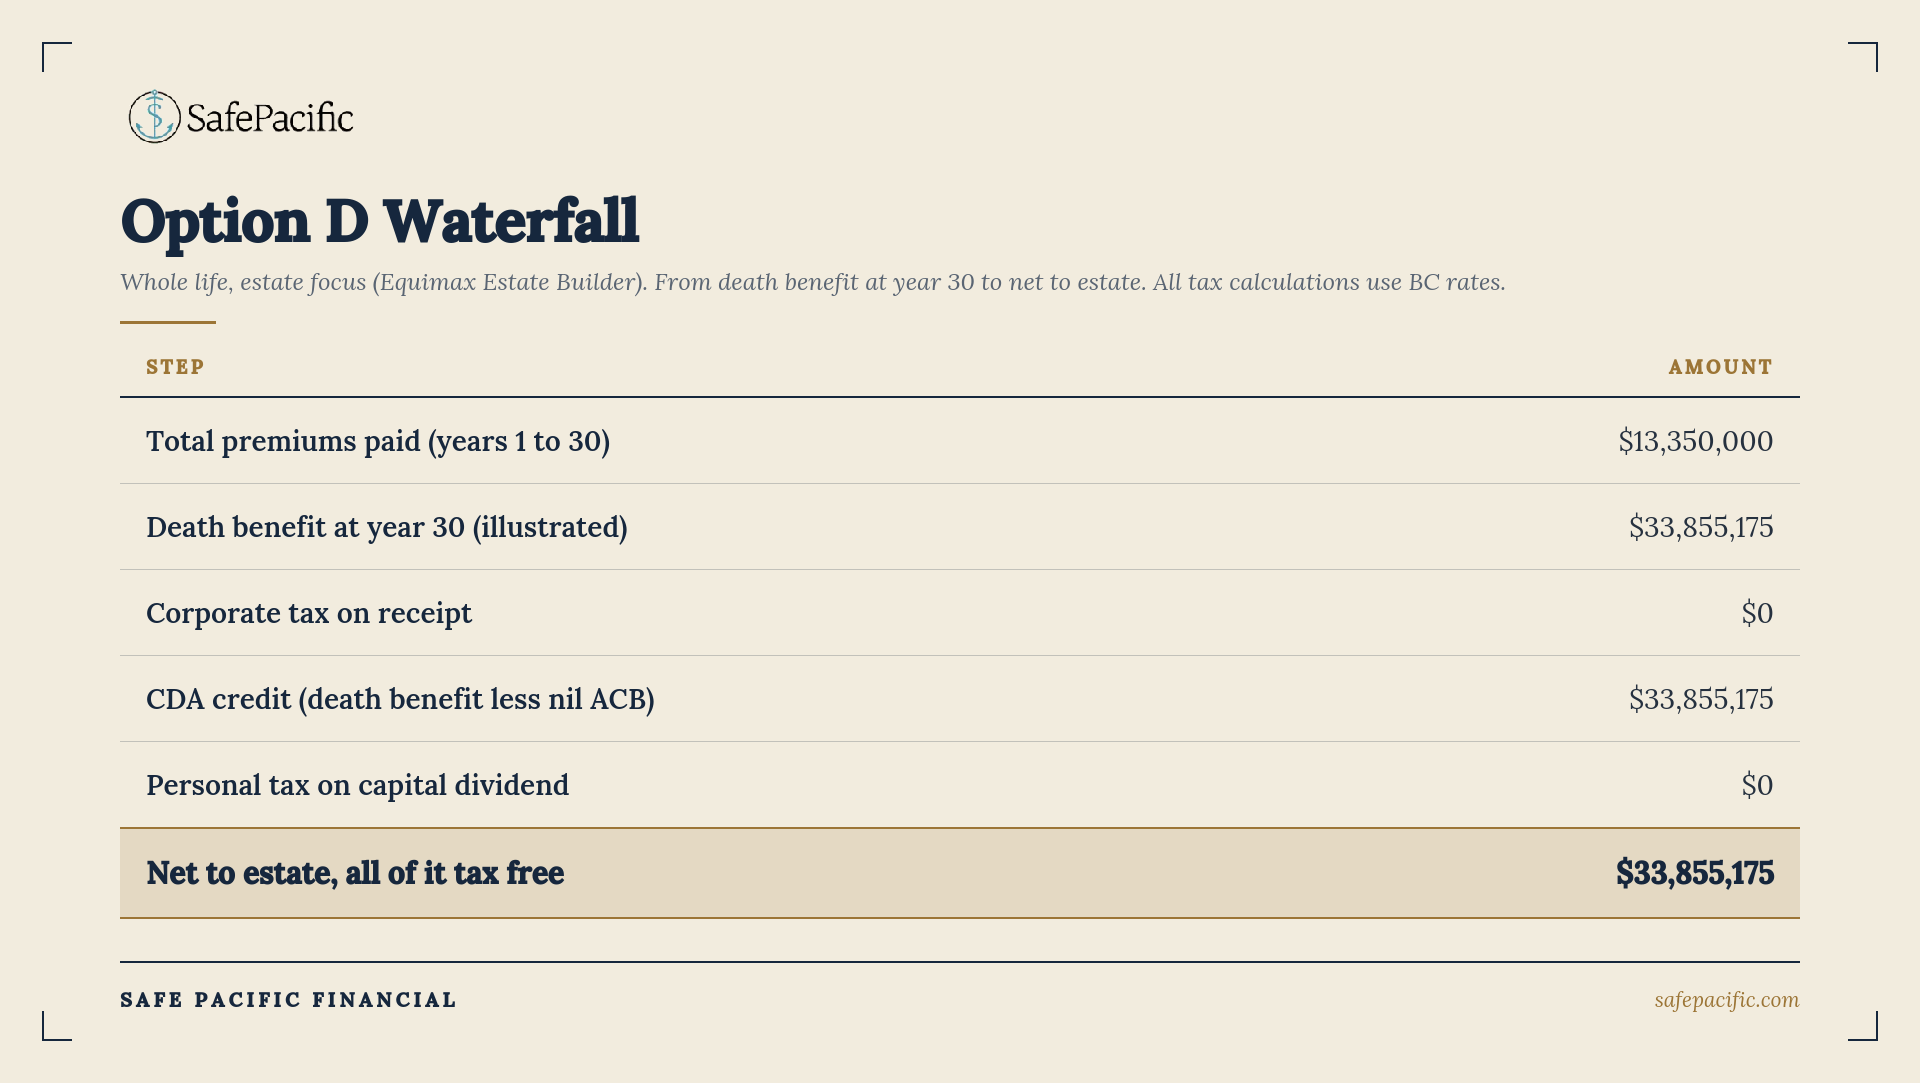
Option D, participating whole life built for estate. An Equimax Estate Builder policy, same insured, same $445,000 annual premium, but with the entire premium buying base coverage: $15,094,979 of permanent insurance from day one. At year 30 the illustrated death benefit is $33,855,175 and the total cash value is $26,538,550. Same dollars, very different shape, and the difference matters enough that it gets its own section below.
The Assumptions
Every number in this article follows from the assumptions below, using British Columbia rates and the actual Equitable Life illustration values. If you want to challenge the conclusion, challenge these.
Option A: The Pure Capital Gains Portfolio
How it works
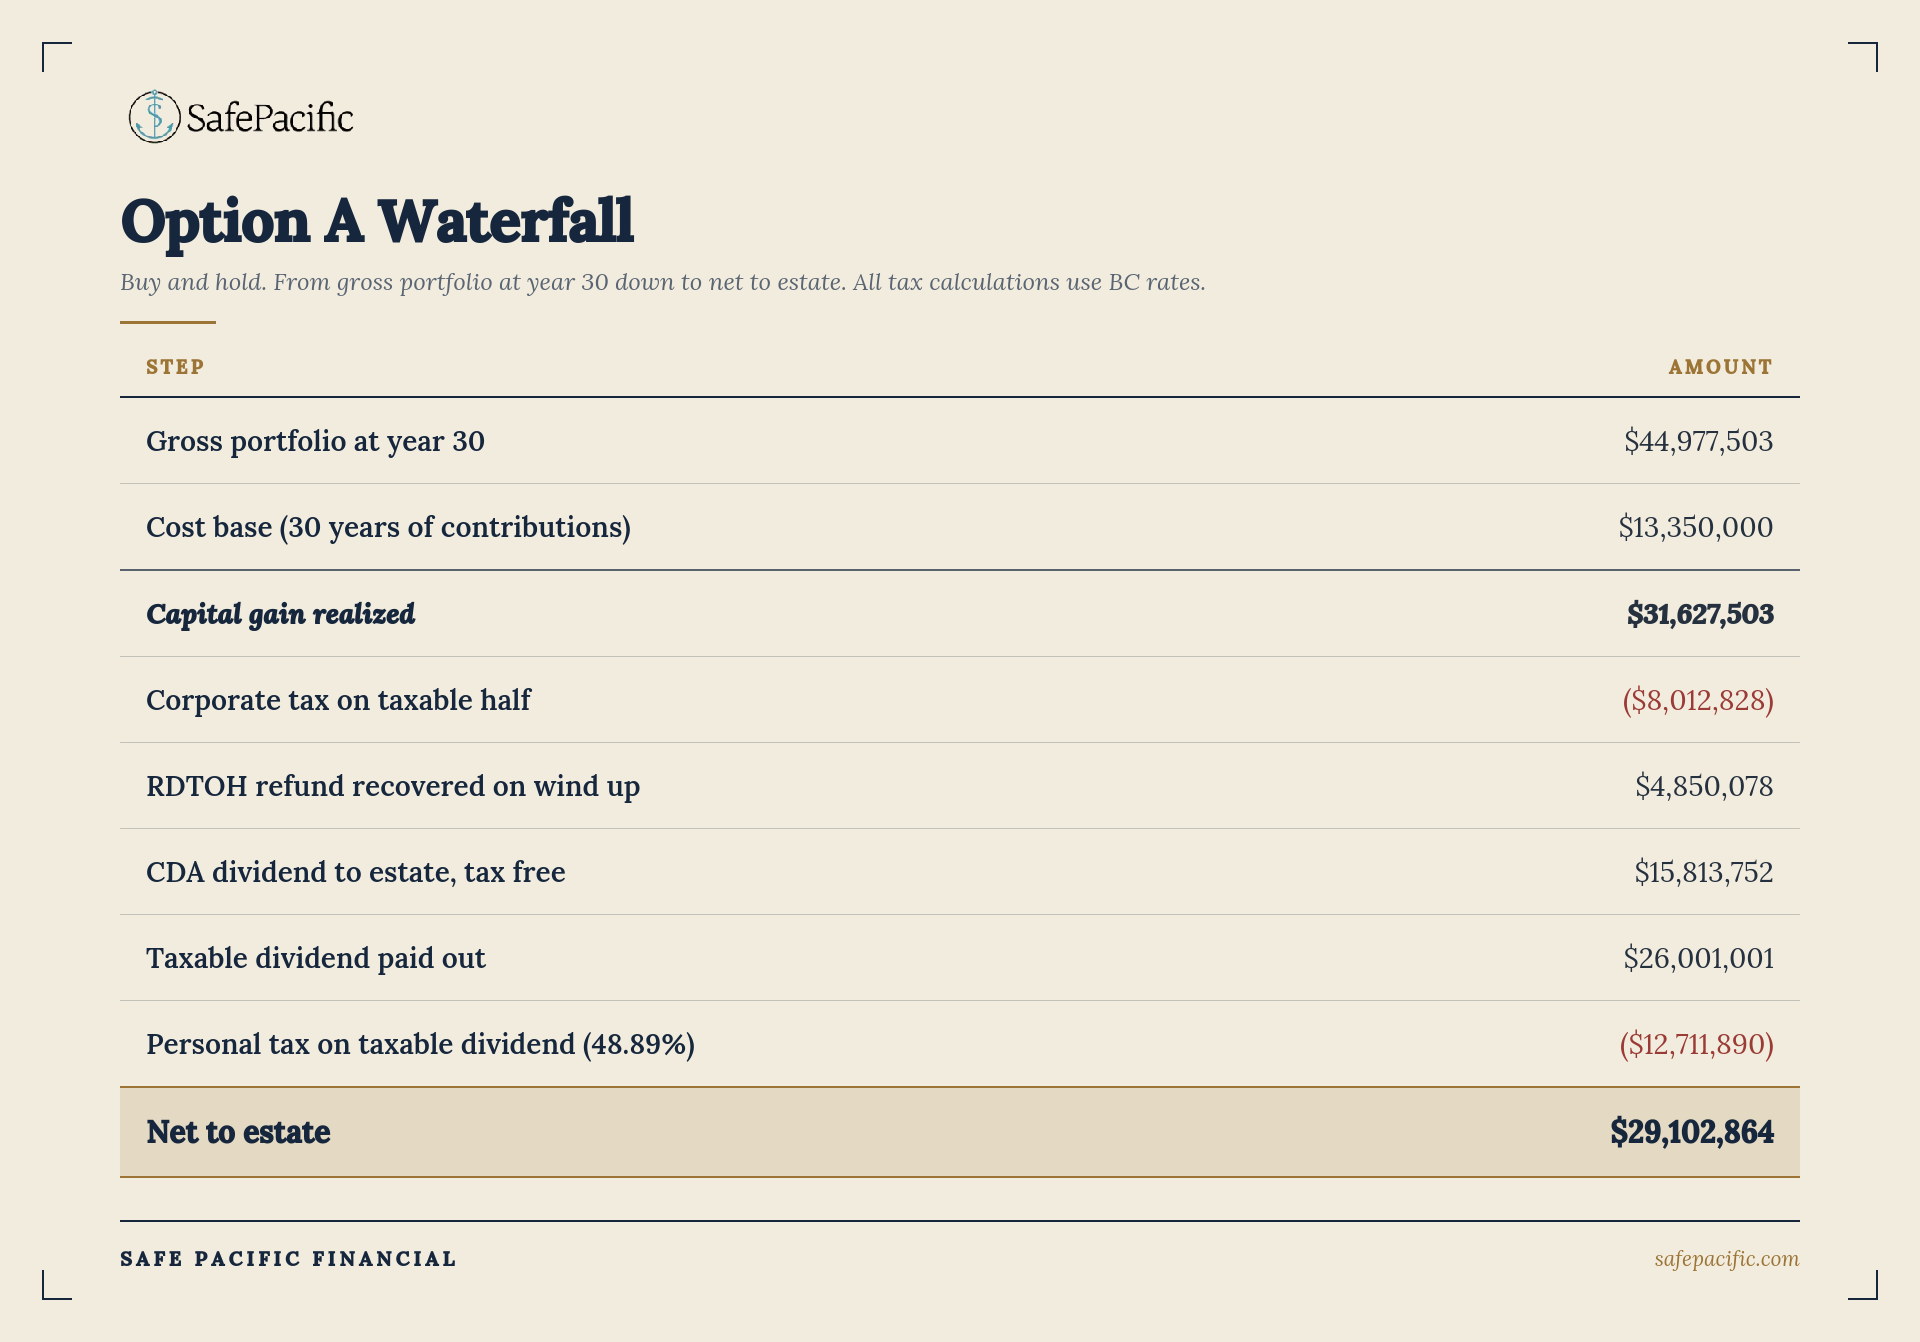
Thirty contributions of $445,000 compounding at 7% with zero tax drag along the way grow to $44,977,503 by the end of year 30. No annual taxation, no grind, no RDTOH bookkeeping, because nothing is ever realized. Then a single liquidation at year 30 triggers a capital gain of $31,627,503, the proceeds of $44.98M less the $13.35M cost base.
The key mechanism: the capital dividend account
When a corporation realizes a capital gain, only half is taxable. The other half lands in a notional account called the capital dividend account, and the corporation can pay that amount to shareholders as a capital dividend with zero personal tax. The CDA exists to preserve the principle that the tax free half of a capital gain should stay tax free even when it flows through a corporation. A lump sum liquidation after 30 years of deferral creates the largest CDA credit a portfolio can possibly produce: $15,813,752.
The taxable half of the gain attracts corporate tax of 50.67%, which is $8,012,828. Of that, $4,850,078 is refundable tax that comes back to the corporation when it pays taxable dividends on wind up. The estate pays the CDA dividend out tax free, then distributes the remaining cash as non eligible taxable dividends of $26,001,001, recovering the full refund along the way. Personal tax at 48.89% takes $12,711,890 of that, and the family keeps $13,289,112 from the taxable layer.
What it does and does not do
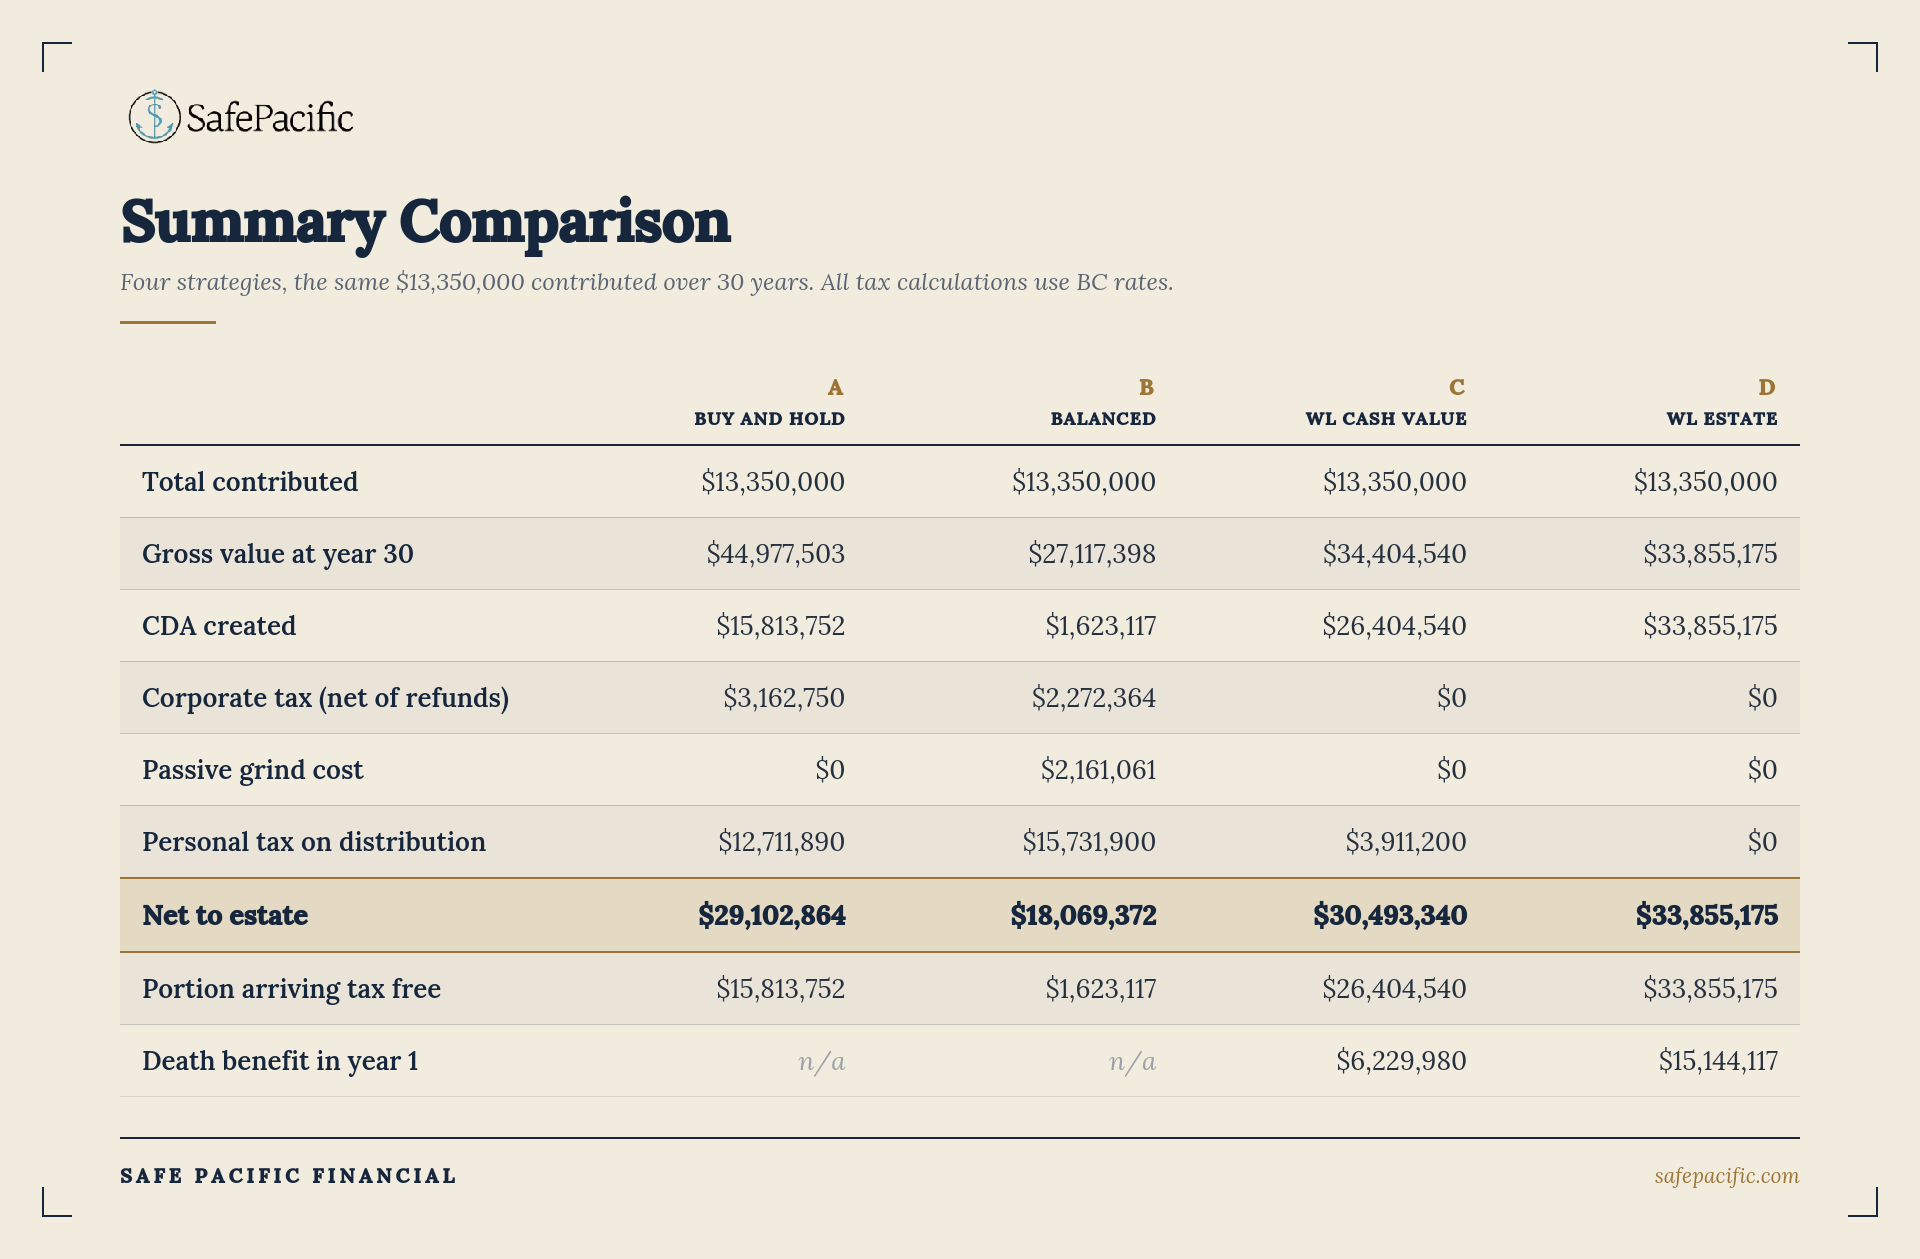
Option A delivers $29,102,864 to the estate, of which $15.8M arrives tax free and $13.3M survives a near 50% haircut. It is the best a corporate portfolio can do, and it depends entirely on a fiction: thirty years with no sales, no rebalancing, no manager changes, no panic in any bear market, and an estate event that waits politely until the end of the projection. The moment any realization happens along the way, Option A starts sliding toward Option B.
Option B: The Balanced Portfolio
How it works
This is the option that looks like a real corporate investment account. The same $13.35M over 30 years at the same 7% gross, but 6 of the 7 points of return arrive as taxable income every single year. The eligible dividends are hit with 38.33% Part IV tax. The bond interest is hit with 50.67% corporate tax. The annual 5% trim realizes a slice of capital gain, half taxed and half credited to the CDA.
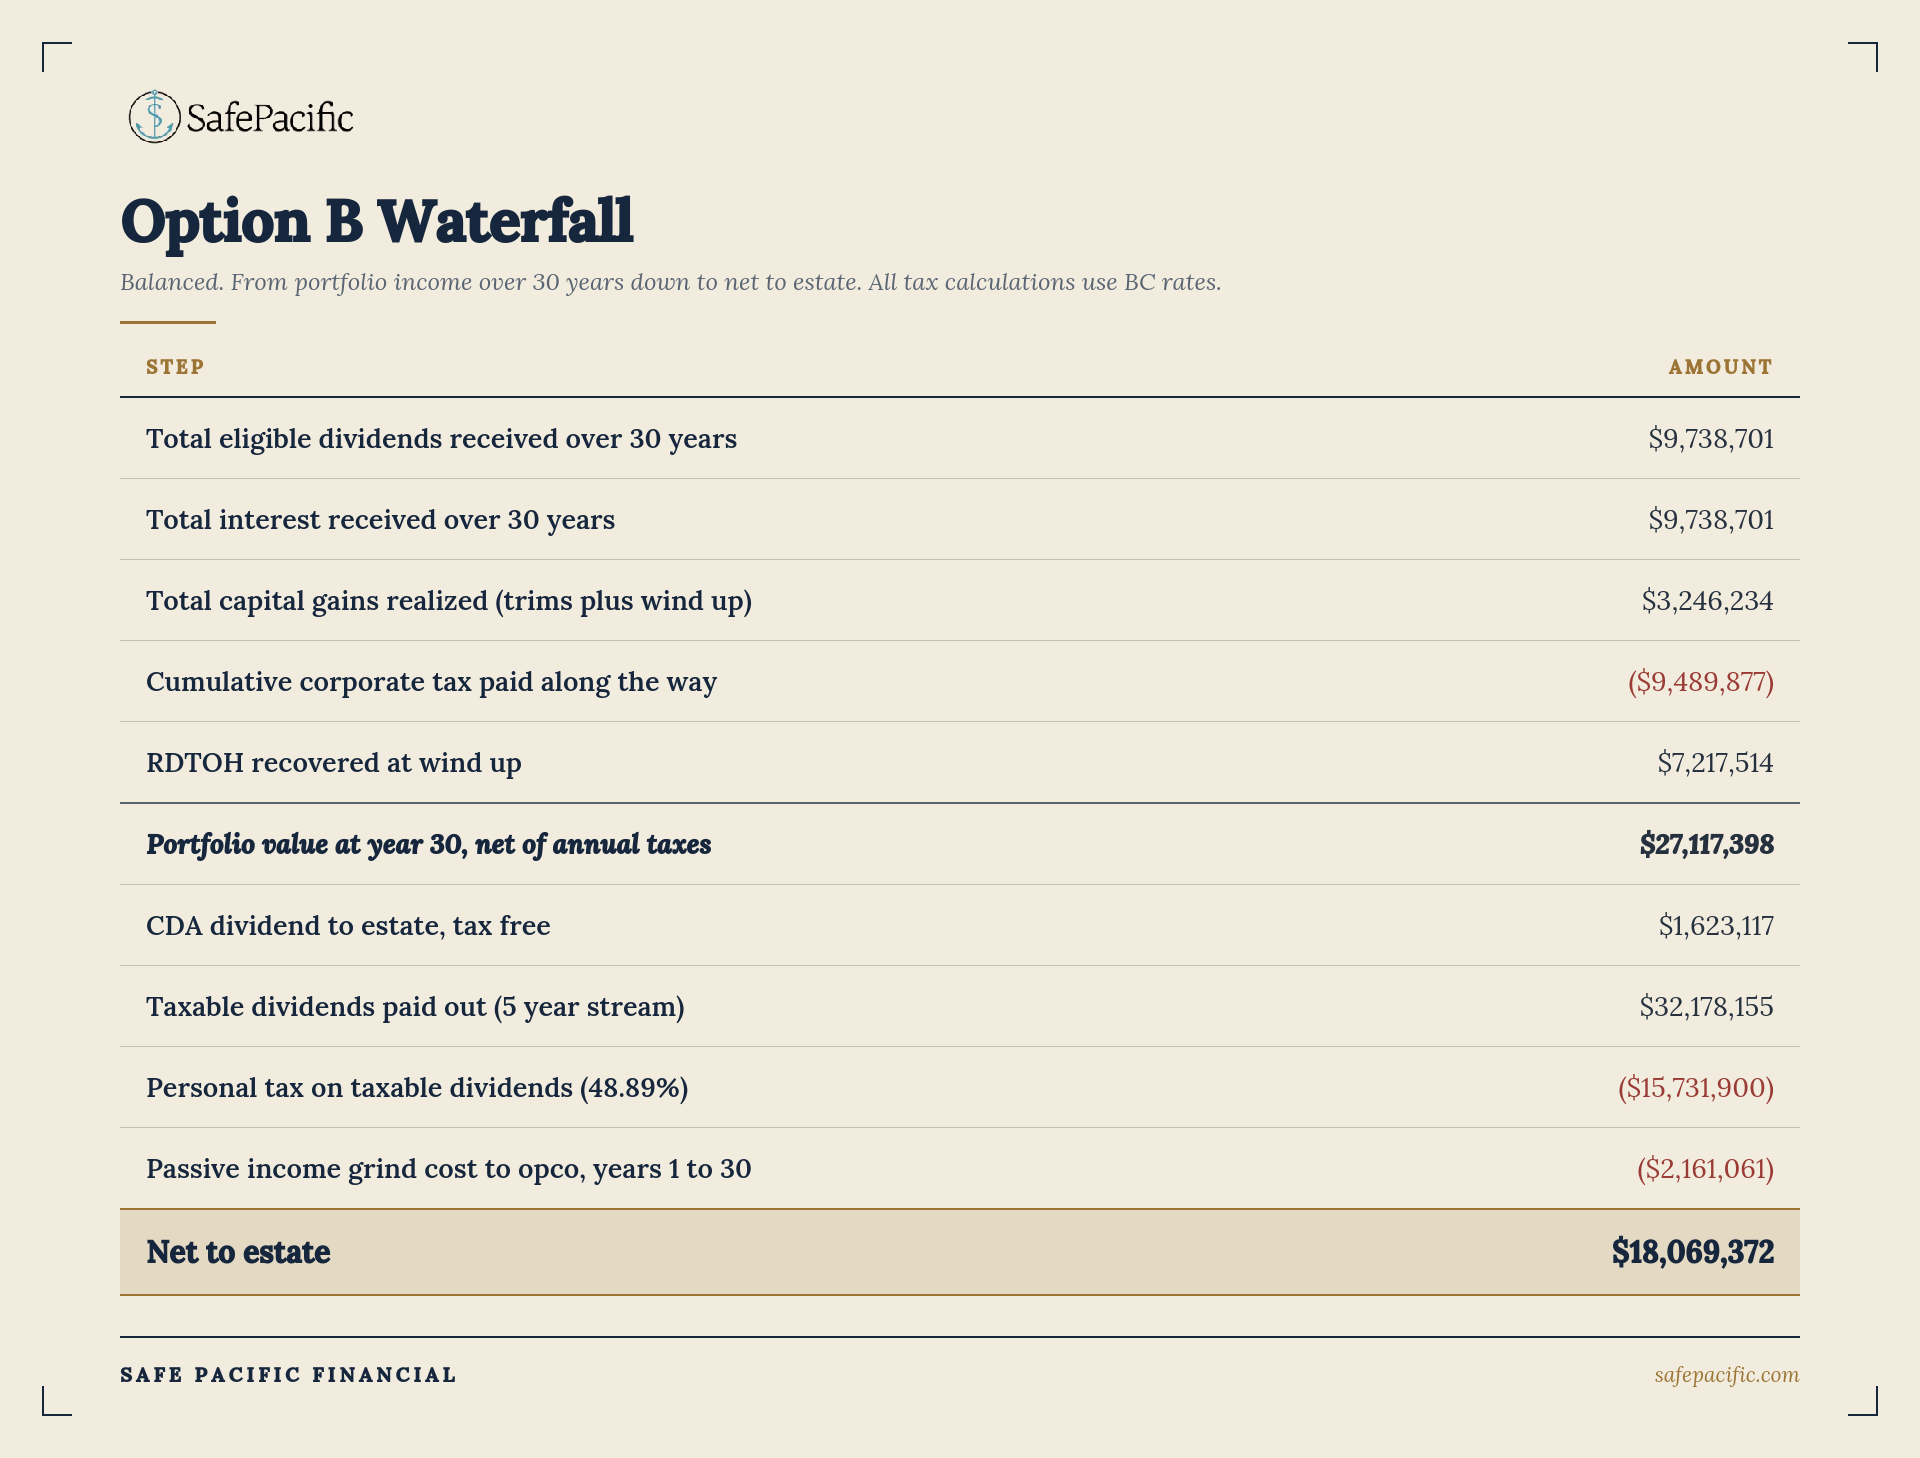
The key mechanism: RDTOH and the cost of waiting for refunds
Most of the tax a corporation pays on investment income is refundable. The 38.33% on dividends is fully refundable, and 30.67 of the 50.67 points on interest and taxable gains is refundable. But the refund only arrives when the corporation pays taxable dividends out, which in this plan means the wind up at year 30. Money paid to CRA in year 4 is money that never compounds for the next 26 years. Over the full period this portfolio pays $9,489,877 of corporate tax along the way and eventually recovers $7,217,514 of it, but the compounding it lost in the meantime never comes back. By year 30 the portfolio is worth $27,117,398 against Option A's $44.98M from the identical gross return. That $17.9M gap is pure tax friction, compounded.
The second mechanism: the passive income grind
The operating company is active for all 30 years, earning the $500,000 profit that funds the contributions. Once the holdco portfolio's passive income crosses $50,000 per year, the opco starts losing its small business deduction at $5 of deduction per $1 of passive income, and within about four years the deduction is fully gone, costing the opco $80,000 per year in extra corporate tax. Because the opco operates for the entire period, the grind runs for the entire period: the cumulative cost over 30 years is $2,161,061. This is the hidden price of holding an income producing portfolio next to an active business, and it never stops as long as both exist.
What it does and does not do
Option B delivers $18,069,372 to the estate. After 30 years of investing, the CDA is only $1.6M, because almost none of the return arrived as capital gain. The dividend and interest heavy structure that feels conservative and income oriented is, from an estate transfer perspective, the most expensive way to hold money inside a corporation. The wind up is modelled as a dividend stream over five years to soften the personal tax hit; at top marginal rates the rate itself does not change, but spreading the income avoids stacking everything into a single terminal return.
Option C: Whole Life Built for Cash Value
How it works
The Wealth Accumulator takes the same 30 payments of $445,000, structured as a smaller base of insurance plus maximum Excelerator deposits that buy paid up additions. This design front loads the cash value: the policy compounds internally with no annual tax, no RDTOH bookkeeping, no grind, and no realization events, and its surrender value tracks the balanced portfolio almost dollar for dollar the whole way. At year 30 the illustrated death benefit is $34,404,540 and the total cash value is $27,692,528.
The key mechanism: ACB and the CDA credit
When a corporation receives a life insurance death benefit, the amount in excess of the policy's adjusted cost basis credits the capital dividend account. The ACB starts as premiums paid and is ground down each year by the net cost of pure insurance, the NCPI, which is a prescribed mortality charge applied to the policy's net amount at risk. This policy carries a net amount at risk of roughly $7M throughout (the gap between the death benefit and the cash value), so the basis erodes steadily but does not reach zero while premiums are still being paid. Per the carrier ACB schedule, the ACB at year 30 (age 85) is $6,731,350.
The ACB matters because that portion of the death benefit does not flow through the CDA. With the $6,731,350 ACB, the CDA credit is $27,673,190, paid to the estate tax free, and the remaining $6,731,350 exits as a taxable dividend netting $3,440,393 after 48.89% personal tax. Net to estate: $31,113,583. One more point worth knowing: the ACB keeps grinding down every year, so each year the insured lives past this projection, the tax free portion grows.
What it does and does not do
The structural advantage is not the return, it is the exit. The policy's internal growth rate does not need to compete with a gross portfolio return; it competes with what survives the corporate tax, the grind, and the personal dividend tax. The trade off of this design is that the early death benefit is modest relative to Option D, because the premium is buying cash value rather than coverage.
Option D: Whole Life Built for Estate
How it works
The Estate Builder takes the identical $445,000 per year, but the entire premium buys base coverage: $15,094,979 of permanent insurance in force from the first day. There is no deposit option and almost no early cash value; the design spends the premium on the largest possible amount of participating insurance, and the dividends buy paid up additions that grow both the death benefit and, eventually, substantial cash value. At year 30 the illustrated death benefit is $33,855,175 and the cash value is $26,538,550.
The key mechanism: an ACB that disappears
Because the net amount at risk on this design is enormous, roughly $15M against near zero early cash value, the annual net cost of pure insurance is far larger than on the cash value design. Cumulative NCPI overtakes cumulative premiums well before age 85, which grinds the ACB to nil. The consequence is clean: the entire illustrated death benefit of $33,855,175 credits the CDA and flows to the estate with zero tax at every level. No corporate tax, no taxable dividend on an ACB remainder, no personal tax. The same caveat applies, request the carrier's ACB schedule, but a nil ACB at age 85 is the standard outcome for an estate maximized design issued at 55.
What it does and does not do
Option D delivers the highest net to estate of all four options, $33,855,175, and it delivers estate protection that does not need time to accumulate. The death benefit starts at $15.1M in year one, when every other option is worth a few hundred thousand dollars. The trade off runs the other way from Option C: early cash values are thin, so this design offers less lifetime flexibility in the first decade. Which is exactly why the choice between C and D deserves its own section.
Two Ways to Build a Policy: Maximum Cash Value versus Maximum Estate
Both policies take the same $445,000 per year from the same corporation for the same 30 years. By year 30 they arrive at nearly the same place: death benefits within 2% of each other, cash values within 4%. The difference is the path, and the path is the planning decision.
Buy the Estate Builder when the job is the estate. If the policy exists to fund a known estate tax liability, the Estate Builder does the job from the moment the first premium clears: $15.1M of coverage in year one versus $6.2M on the cash value design. The estate benefit does not require time to accumulate. A client who dies in year 3 leaves a $15.4M tax free capital dividend instead of a $7.5M one. For pure estate funding, more than doubling the early coverage for the same premium is hard to argue against.
Buy the Wealth Accumulator when lifetime access matters. The cash value design holds a $5.1M cash value lead at year 10. If the client may want to borrow against the policy for opportunities, retirement income, or business needs during the first 15 years, the early cash value is the asset that makes that possible. By year 15 the two designs have nearly converged and the distinction fades.
In practice the choice is a question about the first 15 years: is this money's job protection or flexibility? After that, the participating engine makes the two designs look like siblings.
Summary Comparison
The Tax Breakdown: Every Dollar from Gross to Estate
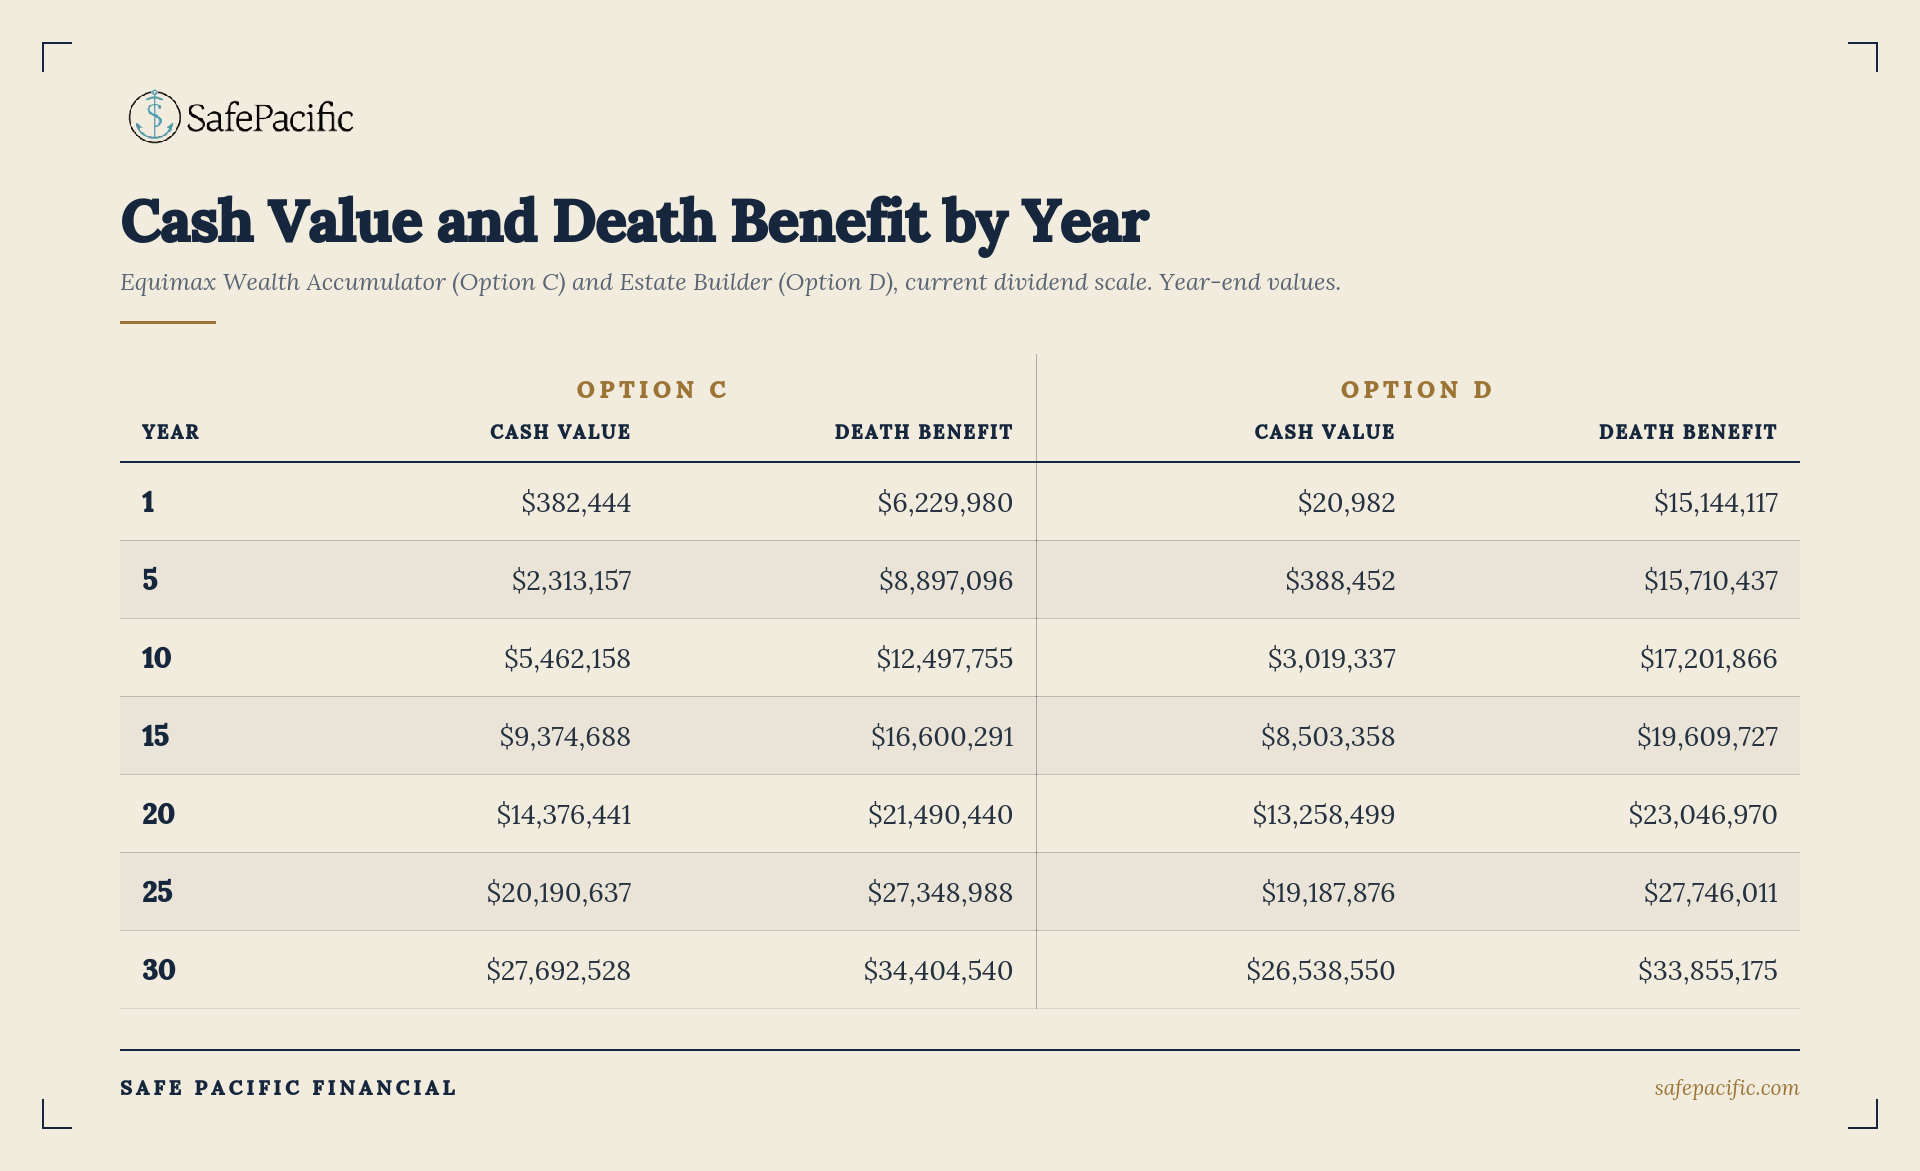
Annual Milestones
Gross values along the way. For Options A and B this is the portfolio market value net of taxes already paid; for the policies, illustrated total cash value and total death benefit.
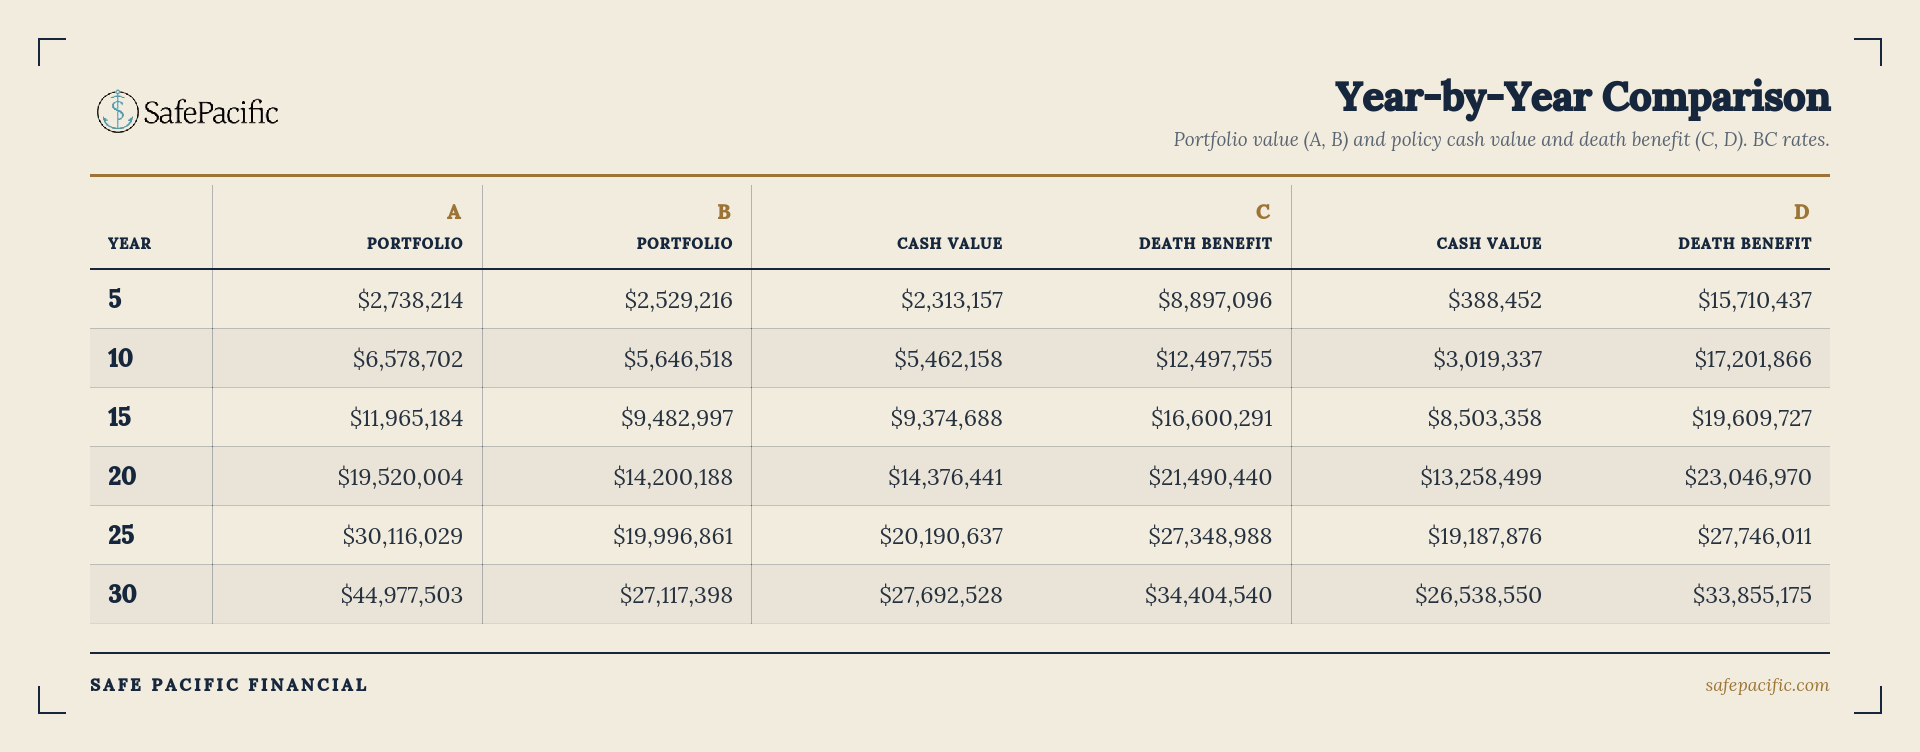
Three things jump out of this table. First, the Estate Builder's death benefit exceeds everything for most of the period and does not require time to accumulate: $15.7M at year 5 against portfolios worth $2.5M to $2.7M gross. Estates do not get to choose when they happen. Second, the Wealth Accumulator's cash value and the balanced portfolio track each other almost dollar for dollar the whole way; the realistic portfolio never builds a meaningful lead over the policy's surrender value, and it carries a large embedded tax bill the cash value does not. Third, even the unrealistic Option A needs more than 20 years just to catch the Estate Builder's gross death benefit, and on an after tax basis it never does.
The Equivalent Return
The cleanest way to compare the structures is to ask: what gross annual return does each portfolio need to earn so that its net to estate equals each policy's net?
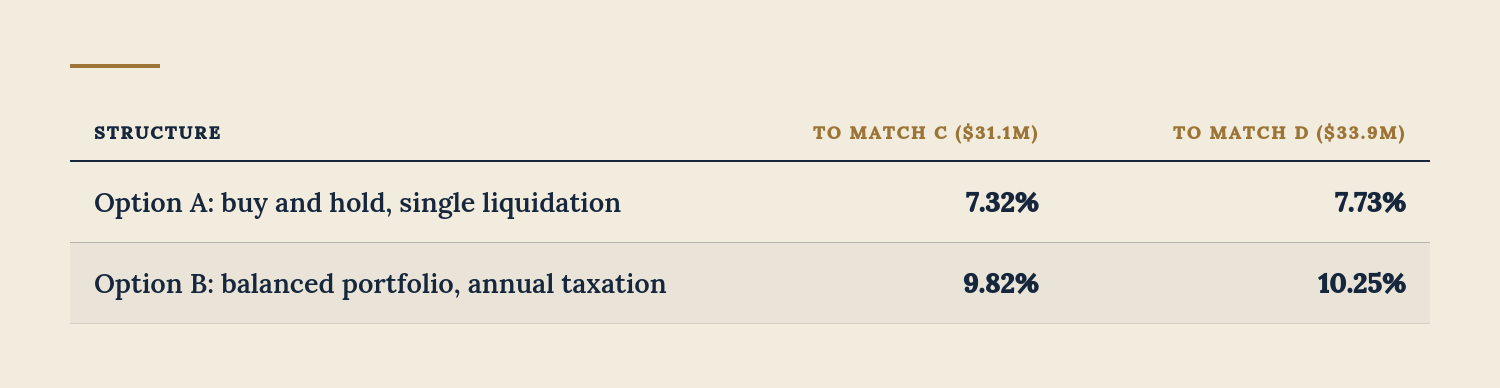
Option B needs 9.82% to 10.25% gross, every year, for 30 years. That is the honest hurdle for a real world corporate portfolio. The three layers of drag, annual corporate tax on income, the passive grind running for the entire 30 years, and personal dividend tax on nearly the entire wind up, compound against each other so relentlessly that the portfolio must outrun the policies by roughly three full points of gross return just to tie them.
Option A needs 7.32% to 7.73%, above the assumed 7%. Even the theoretical never sell portfolio, with zero realizations for three decades and the largest CDA credit a portfolio can produce, falls short of both policies at the same gross return. And look at the composition: Option A's $29.1M arrives as $15.8M tax free and $13.3M that survived a 48.89% haircut. The Estate Builder's $33.9M arrives entirely tax free. The impossible portfolio loses by a little; the realistic one loses by $12.4M to $15.8M.
The policies need no equivalent return boost. The policy's rate is not competing with the gross investment return. It is competing with what actually arrives in the estate after every layer of tax, and its exit carries almost no tax friction, no dependence on a single year 30 liquidation going smoothly, and a death benefit that exceeded the portfolios for most of the journey. That is the framing that lands with clients.
The Most Realistic Outcome: it is not OR, it is AND
Everything above compares pure strategies, all $445,000 into one bucket, because pure strategies make the mechanics visible. But putting every dollar into any single option is rarely the right answer for a real client. A portfolio only client carries the full weight of the tax friction and the grind. A policy only client gives up market upside and concentrates everything in one asset and one carrier. The most realistic outcome, and usually the best one, is a blend.
The insurance is the fixed income
Look back at where Option B bleeds. The worst taxed dollar in the entire analysis is the bond interest: taxed at 50.67% every year, generating the passive income that drives the grind, and producing zero CDA. The policy is the natural replacement for exactly that allocation. Participating whole life behaves like a fixed income asset, steady compounding, vested values that never go backwards, but it compounds without annual tax, creates no passive income for grind purposes, and converts into the largest possible CDA credit at death. So the blend is not insurance versus the portfolio. It is insurance as the fixed income sleeve of the portfolio, with the equities staying in the investment account where capital gains treatment and the CDA already favour them.
A simple illustration
Split the same $445,000 down the middle: $222,500 per year into the Wealth Accumulator (policy values scaled proportionally from the illustration, an approximation a carrier reproposal would refine) and $222,500 per year into an equity only corporate portfolio earning the same 7% gross as 3% eligible dividends plus 4% appreciation, trimmed 5% annually, with no bonds at all.
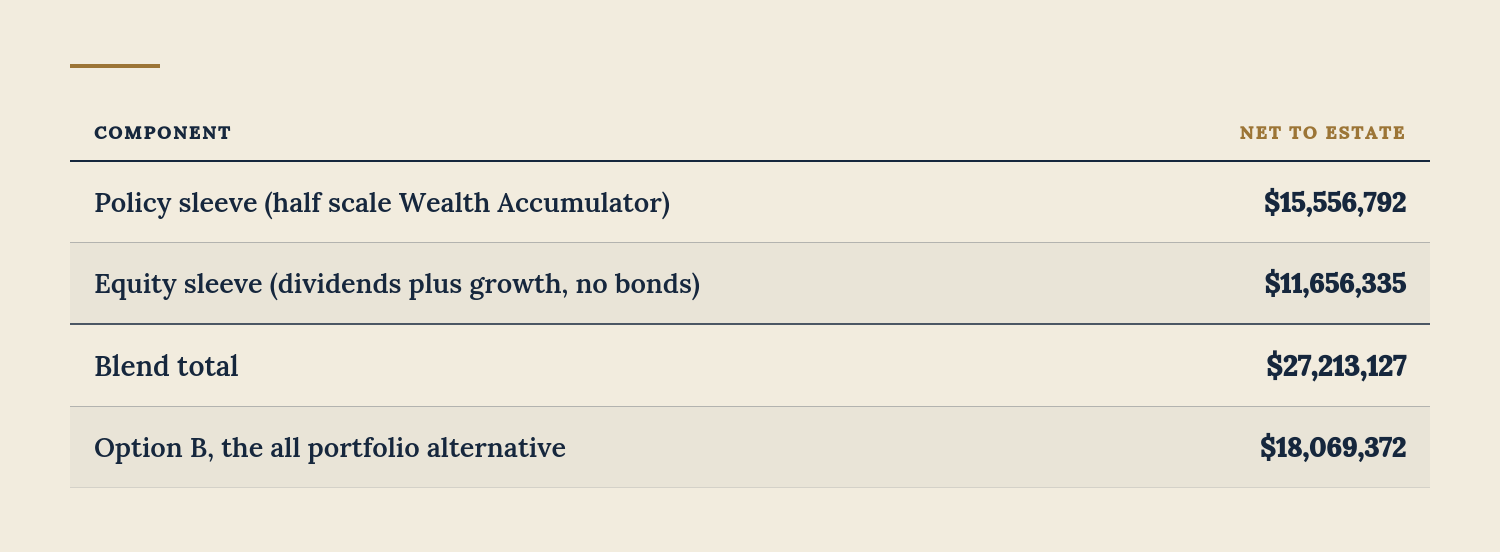
The blend delivers $27.2M against the realistic all portfolio outcome of $18.1M, an improvement of $9.1M from doing nothing more than moving the fixed income allocation into the policy. It gives up some terminal estate value against the pure policy options, but in exchange the client keeps a liquid, growing equity portfolio they control, full market upside, and the flexibility to change course. The client does not have to choose between the best estate outcome and a real investment portfolio. The policy makes the portfolio better, and the portfolio keeps options open that a policy only plan does not.
Liquidity and the IFA
A common objection to the policy allocation is locked up capital, and it is the wrong mental model. Whole life cash value is among the most lendable collateral in the country: lenders routinely advance up to 90% or even 100% of the cash surrender value, far above the loan to value available on a stock portfolio. For a corporate client this opens the immediate financing arrangement, where the corporation pays the premium, immediately borrows against the cash value, and redeploys the borrowed capital back into the business or the investment portfolio. Structured properly, the interest can be deductible while the policy keeps compounding untouched. The IFA also pairs naturally with the rebalancing problem in the equity sleeve: instead of selling appreciated positions and realizing gains to fund premiums, the client borrows against the policy and lets the unrealized gains keep deferring. The capital works twice.
What this Means in Practice
The real comparison is B versus the policies. Clients do not run 30 year zero realization portfolios. They run something like Option B. And Option B delivers $18.1M against $31.1M to $33.9M from identical contributions, a gap of $13.0M to $15.8M, or 72% to 87% more to the estate. That is the number that should anchor the conversation, and the blend section above is how to act on it without abandoning the investment portfolio.
The policy is arguably the least risky asset in this article. Options A and B carry full market volatility for 30 years, and Option A adds a concentrated bet that a single liquidation lands in a good year; a bear market at the wrong moment changes the ending badly. The participating policy moves in one direction: dividends, once credited, vest and buy paid up additions that cannot be taken away, sitting on top of guaranteed cash values and a guaranteed death benefit. The dividend scale can fall, which slows future growth, but the surplus already built is locked in. The comparison is not high return versus low return; it is volatile and taxable versus vested and tax free.
The estate benefit can start on day one. The portfolio strategies need decades to accumulate before they can fund the estate liability, and they need the client to survive long enough to let them. The Estate Builder writes a $15.1M cheque from the first premium. For a client whose actual problem is a known estate tax bill, that immediacy is the difference between a funded plan and a hopeful one.
The passive grind clock never stops. The portfolio crosses the $50,000 passive income threshold within the first few funding years, and the opco's small business deduction is fully gone by roughly year four, costing $80,000 per year for every remaining year the opco operates, $2,161,061 over 30 years. The policies are immune entirely, because policy growth is not passive investment income, which means an owner can fund a policy at full scale without ever touching the opco's small business rate.
The planning runway matters more than the rate. Rates are debatable, dividend scales move, and tax law changes, but the structural point holds: the portfolios are not losing because of a bad return. They are losing because 35% to 60% of the finishing value gets stripped off at the tape, and they need to run faster the entire time just to end up in the same place.
Figures use BC top marginal rates as of today, current dividend scales from the Equitable illustrations, a constant 7% return, the Wealth Accumulator ACB of $6,731,350 at age 85 per the carrier schedule, and an estimated nil ACB for the Estate Builder. The Estate Builder illustration was generated for an Ontario resident; policy values do not vary by province and all tax math here uses BC rates. None of this is tax or legal advice; it is a framework for the conversation with the client's accountant and lawyer in the room.


Book Your Consultation
Book a meeting with Safe Pacific today to design a strategy that fits your goals.
The Estate Tax Bill Most Business Owners Never See Coming
What actually arrives in the estate from a corporate investment portfolio versus a corporately owned life insurance policy. Every projection a business owner sees starts with the...

Use the Capital Dividend Account to Distribute Tax-Free Wealth
Eventually, every Canadian business owner asks the same question. How do I get this money out of my corporation without getting crushed by taxes? There...

Stop Under-Saving: How to Max Out Your FHSA
Everyone is talking about how expensive Canadian real estate has become. Almost no one is talking about how badly the average Canadian is underusing their...

The Estate Bond Strategy
How High-Income Canadians Pass Their Wealth On, Tax-Free Most Canadians assume the biggest threat to their wealth is the market. A bad year, a downturn,...

What Happens When You're Done Building?
There's a shift that happens in the lives of most business owners that almost nobody talks about. After years (sometimes decades) of focusing on growth,...

How to Borrow from Yourself Safely Using Life Insurance
High-income Canadians know the value of liquidity—but too often, accessing capital means triggering taxes, taking on debt, or selling investments at the wrong time. What...

Are You Ready for the Strategy You Want?
We've noticed a pattern in client meetings over the past few weeks that we want to talk about openly. Business owners are coming in excited...

RRSP vs. TFSA: Which Is Better for High Income Canadians
If you're a high-income Canadian, here's the truth: using RRSPs and TFSAs the wrong way could mean paying far more to the CRA than you...

The Million Dollar Baby Plan: Grow a Legacy for your Children
What if the birthday gift you gave your child today could turn into a million-dollar asset tomorrow? That's the idea behind the Million Dollar Baby...

Before You Sell Your Investments, Read This.
Markets are down, your portfolio took a hit, and you're wondering—should I sell now and cut my losses? Stop. Because selling during a market downturn...

Why Life Insurance Isn't Just for When You Die
If you think life insurance is something you'll never personally benefit from, you're missing the bigger picture. Permanent life insurance can provide liquidity, protect your...
Whole Life Insurance vs. Universal Life Insurance
Permanent life insurance can double as a powerful wealth-building tool—but not all policies are created equal. If you're an incorporated Canadian professional or business owner...